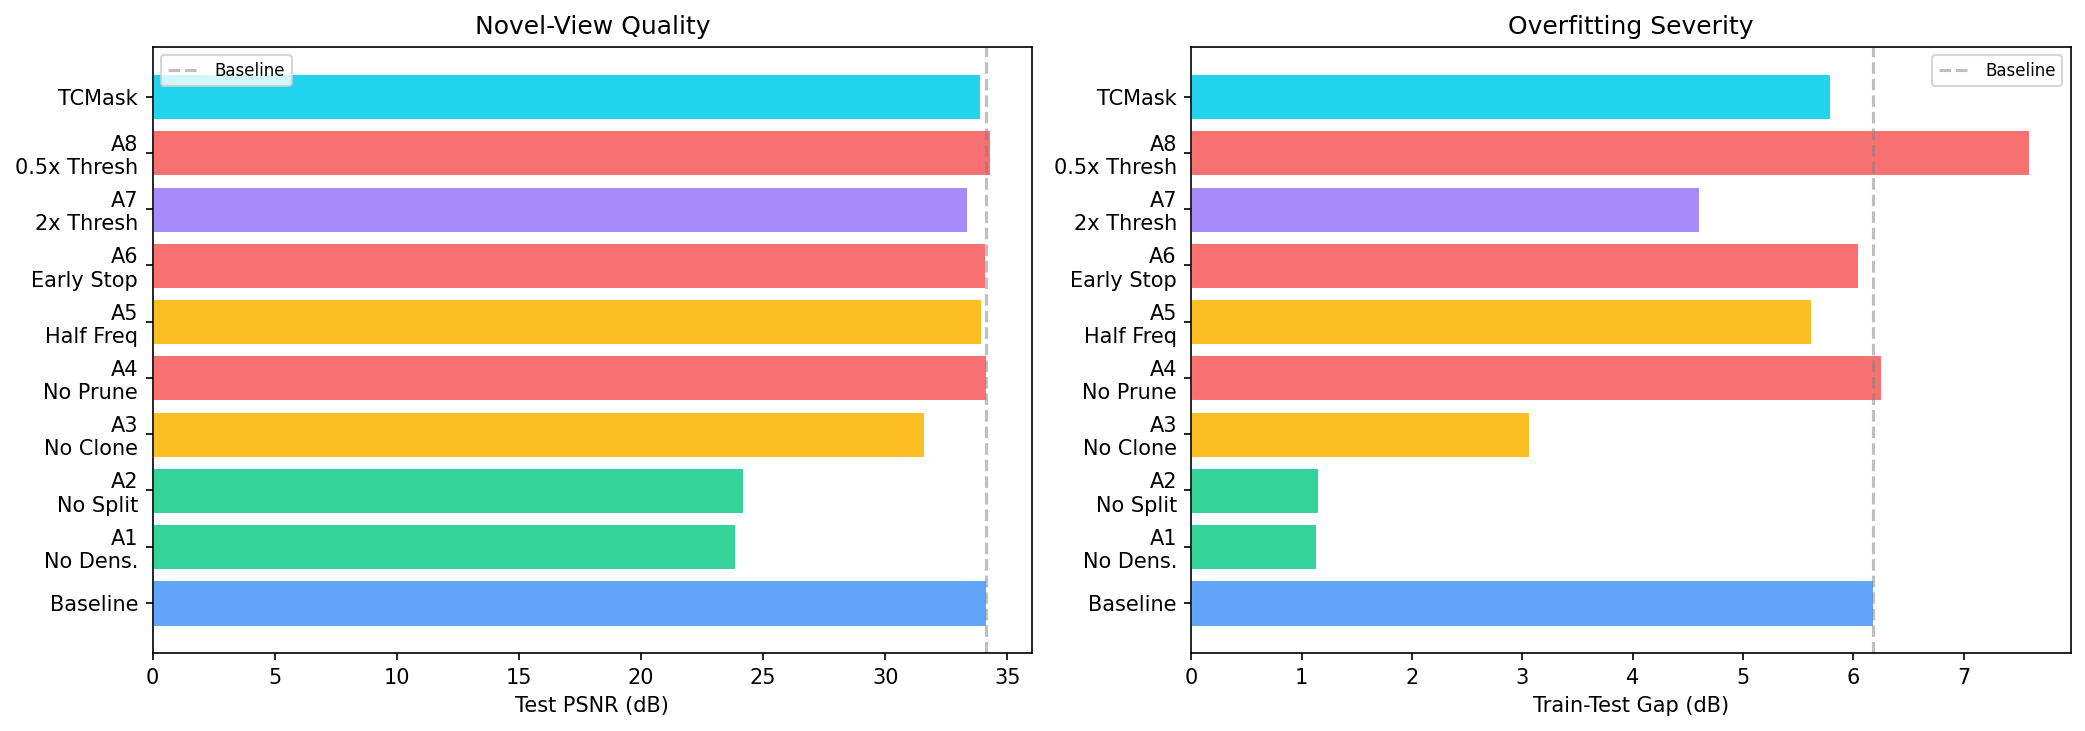
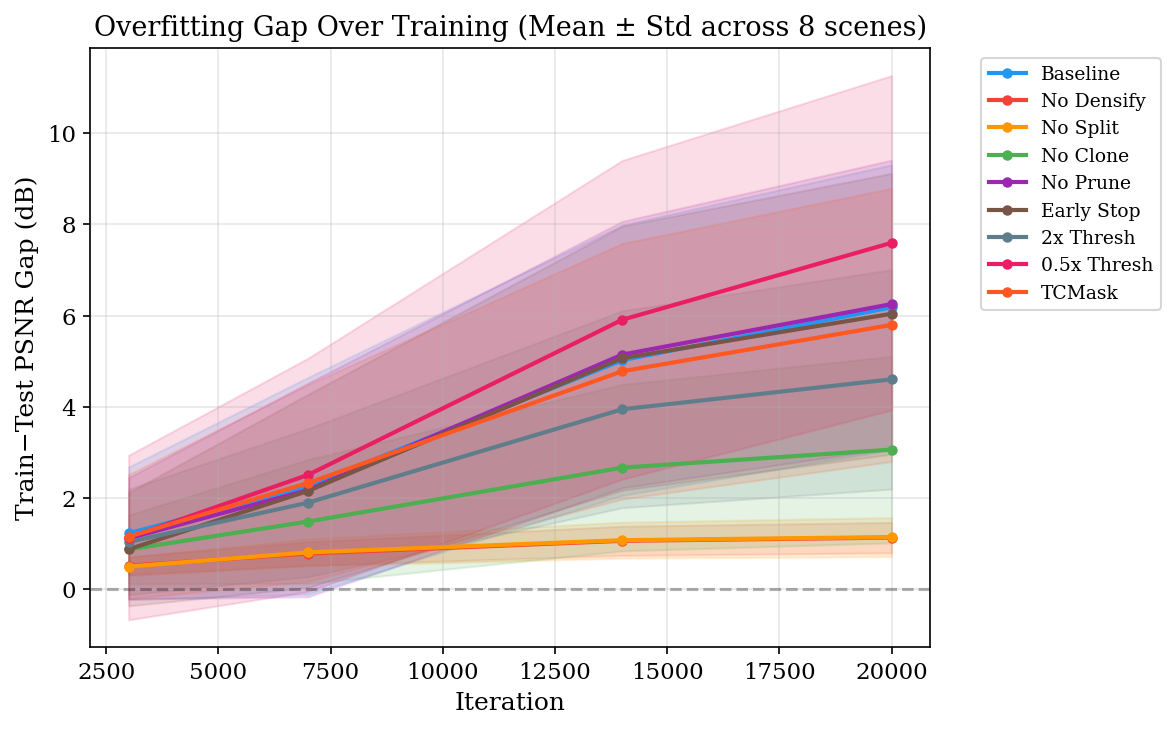
1. Split is the bottleneck of the cascade
Disabling split collapses both the cloud (2K vs 44K Gaussians) and the gap (1.15 dB vs 6.18 dB) — but also collapses test PSNR by 9.93 dB, so it is not a viable mitigation. Disabling pruning changes nothing.
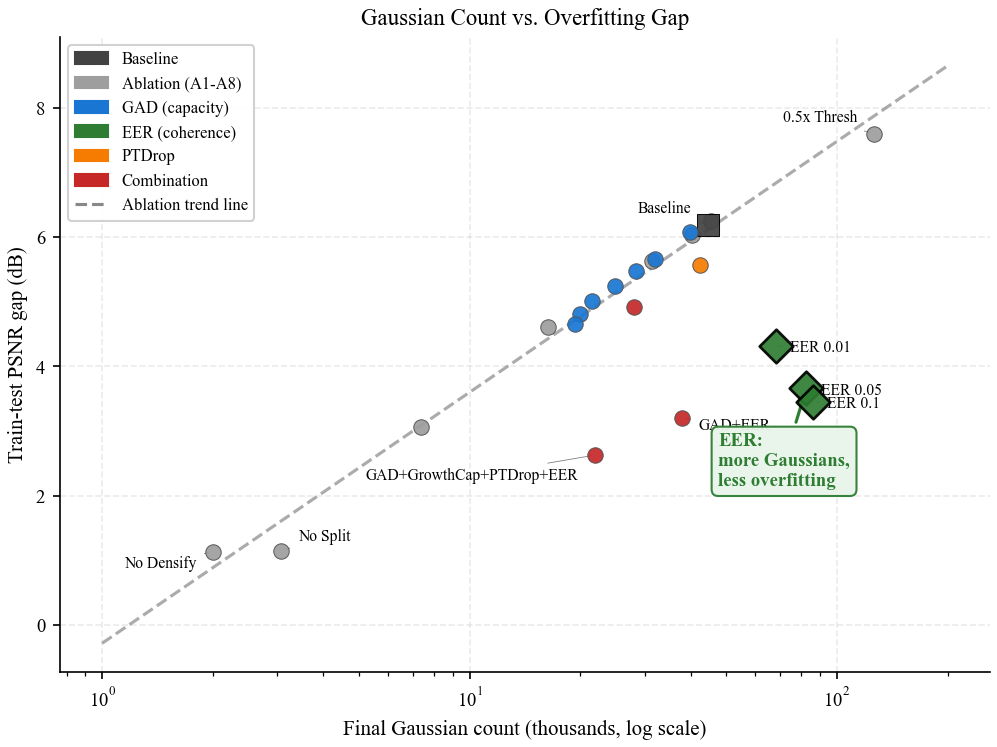
Dynamic 3D Gaussian Splatting overfits by 6.18 dB on average on D-NeRF. A systematic ablation identifies the split operation as the bottleneck of the overfitting cascade: disabling it eliminates the gap (1.15 dB) but also collapses test PSNR by 9.93 dB, so it is not a viable mitigation. Across 9 ablation conditions, gap is monotone in count (Spearman ρ = 1.00). A local k-NN strain prior on the deformation field breaks this pattern: it reduces the gap by 40.8% while growing the cloud by 85%. A controlled ablation against E-D3DGS-style embedding smoothness and an SC-GS-style ARAP residual shows the three normalized variants are statistically tied — the canonical-distance normalization is the load-bearing element, not the choice of encoding. Our recommended combination GAD+EER closes 48.2% of the gap; the full stack reaches 57.4%.
Dynamic 3D Gaussian Splatting achieves impressive novel-view synthesis on monocular video by coupling a deformable point cloud with Adaptive Density Control (ADC), but exhibits a severe train–test generalization gap. On the D-NeRF benchmark (8 synthetic scenes) we measure an average gap of 6.18 dB (up to 11 dB per scene) and, through a systematic ablation of every ADC sub-operation (split, clone, prune, frequency, threshold, schedule), identify splitting as the bottleneck of the overfitting cascade — disabling split eliminates the gap (1.15 dB) but also collapses test PSNR by 9.93 dB, so it is not a viable mitigation. Split is the operation through which the cascade flows, not a knob one can simply turn off.
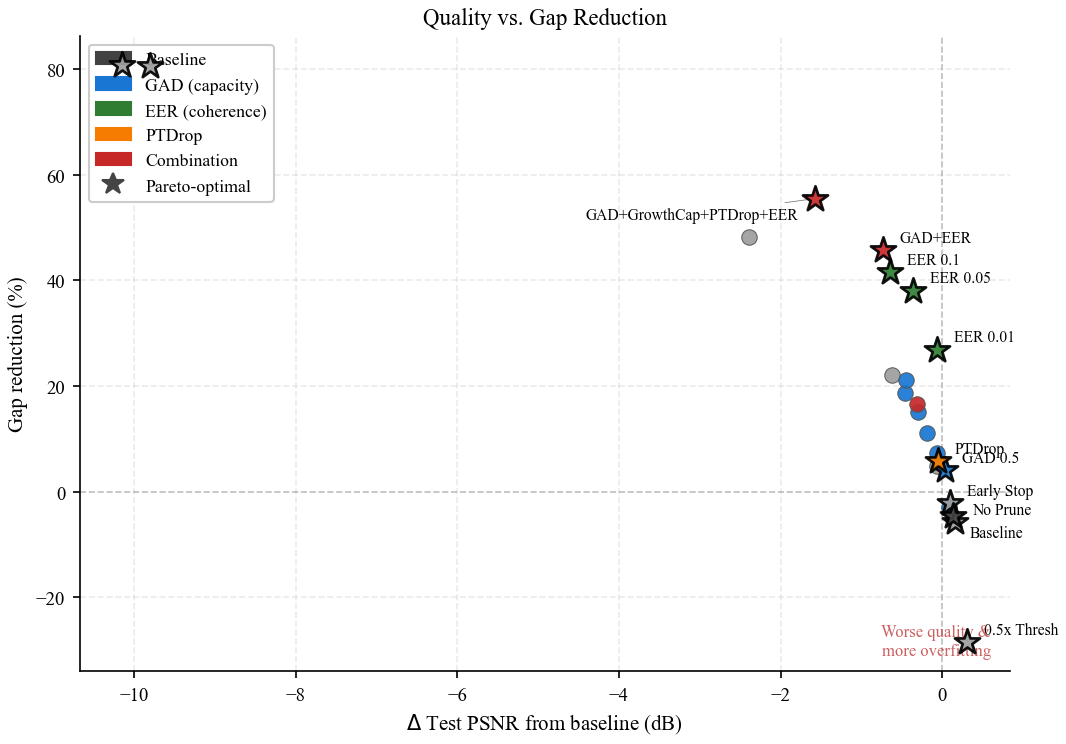
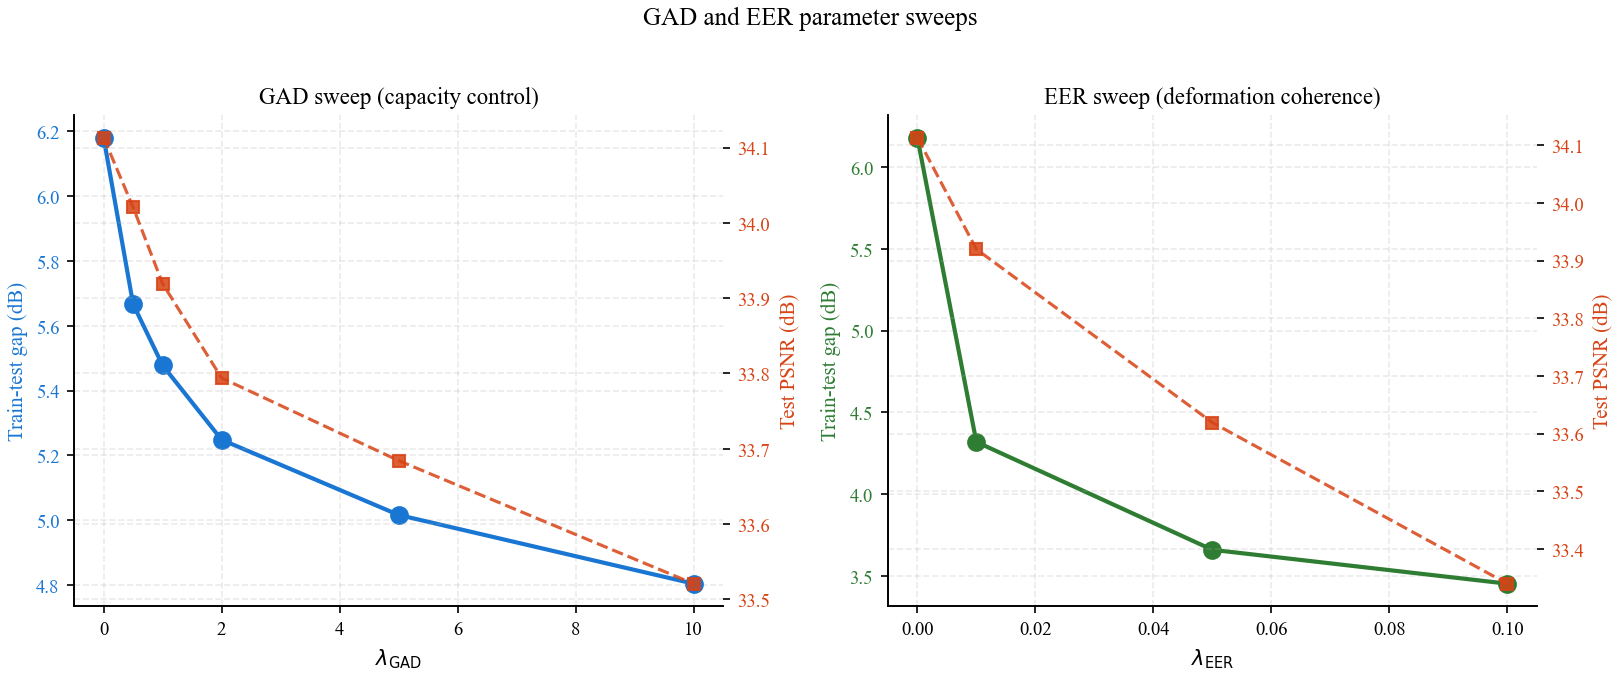
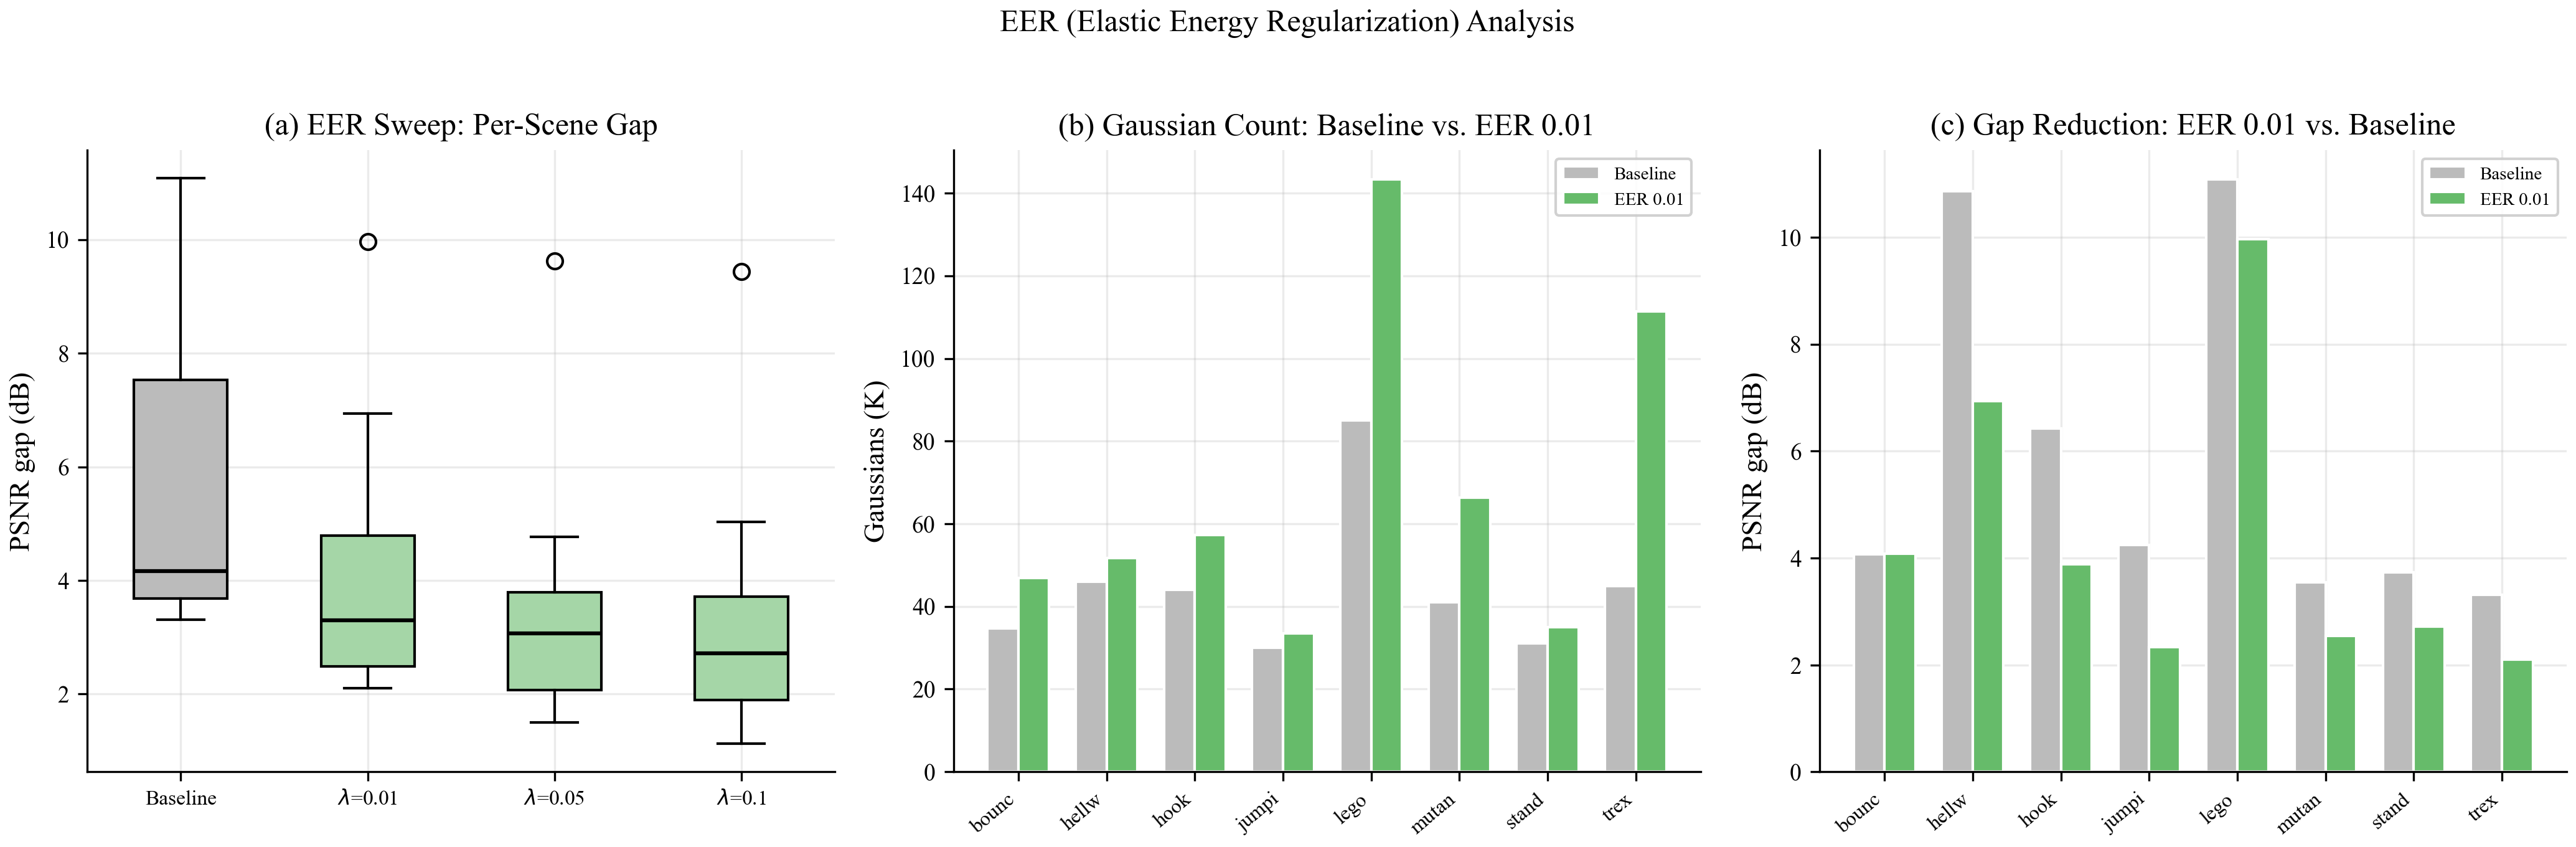
Our central finding is that a local smoothness penalty on the per-Gaussian deformation field — we use a k-NN strain prior we call EER — breaks the count–gap correlation observed across ablations: it reduces the gap by 40.8% while growing the cloud by 85%. This reframes overfitting from a capacity problem to an incoherent deformation problem. A controlled ablation against E-D3DGS-style per-embedding smoothness and an SC-GS-style ARAP residual shows the three normalized variants achieve statistically tied gap reductions (47.5% / 46.1% / 40.4%); dropping the canonical-distance normalization disables the prior entirely (+2.2%). The substantive contribution is therefore not a new method but the diagnostic finding plus the identification that the canonical-distance normalization is the load-bearing element of these priors. Combined with GAD (a loss-rate-aware densification threshold), the recommended configuration GAD+EER closes 48.2% of the gap; adding PTDrop (jitter-weighted dropout) and a soft cloud cap reaches 57.4% at larger quality cost.
Findings are validated on D-NeRF (8 synthetic scenes), Deformable-3DGS (cross-architecture), and HyperNeRF (5 real-world scenes; +16.1% gap reduction on the high-baseline-gap subset, neutral on low-baseline scenes). EER's k-NN cost scales with cloud size; approximate-NN structures are needed to scale beyond ~100K Gaussians on consumer hardware.
Disabling split collapses both the cloud (2K vs 44K Gaussians) and the gap (1.15 dB vs 6.18 dB) — but also collapses test PSNR by 9.93 dB, so it is not a viable mitigation. Disabling pruning changes nothing.
r = 0.995 on 9 ablation conditions, holding within both sub-clusters (r = 0.998 on high-count, 0.95 on low-count) and across 41 non-EER configurations (r = 0.987).
+85% Gaussians, −40.8% gap. At the per-Gaussian level, EER reduces deformation strain by 99.6% on Lego, 99.8% on T-Rex, 99.6% on Hellwarrior.
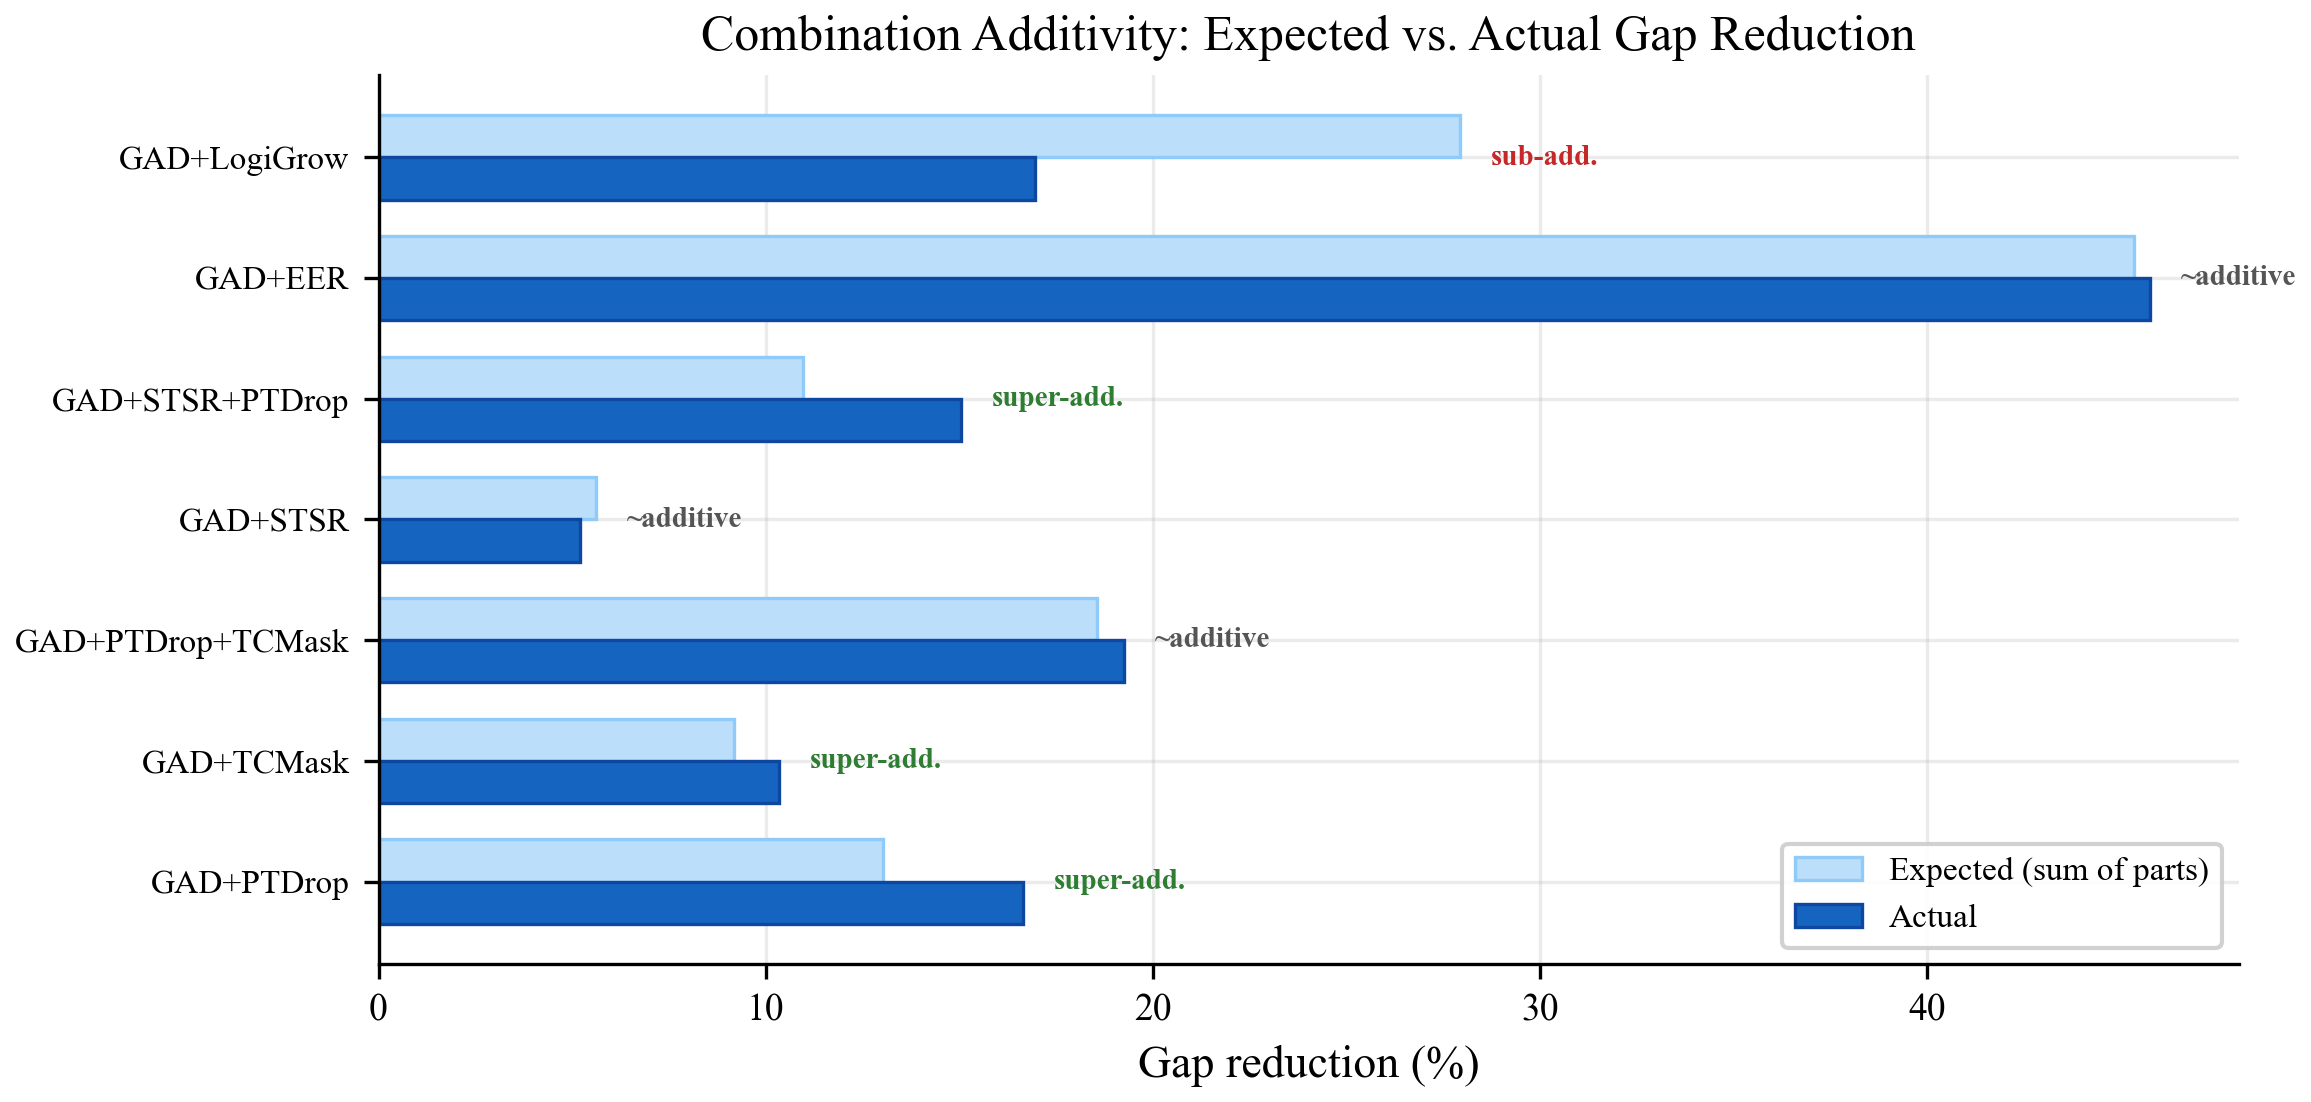
GAD+EER = 48.2% reduction. Adding LogiGrow + PTDrop = 57.4%, the only configuration in our sweep to more than halve the gap.
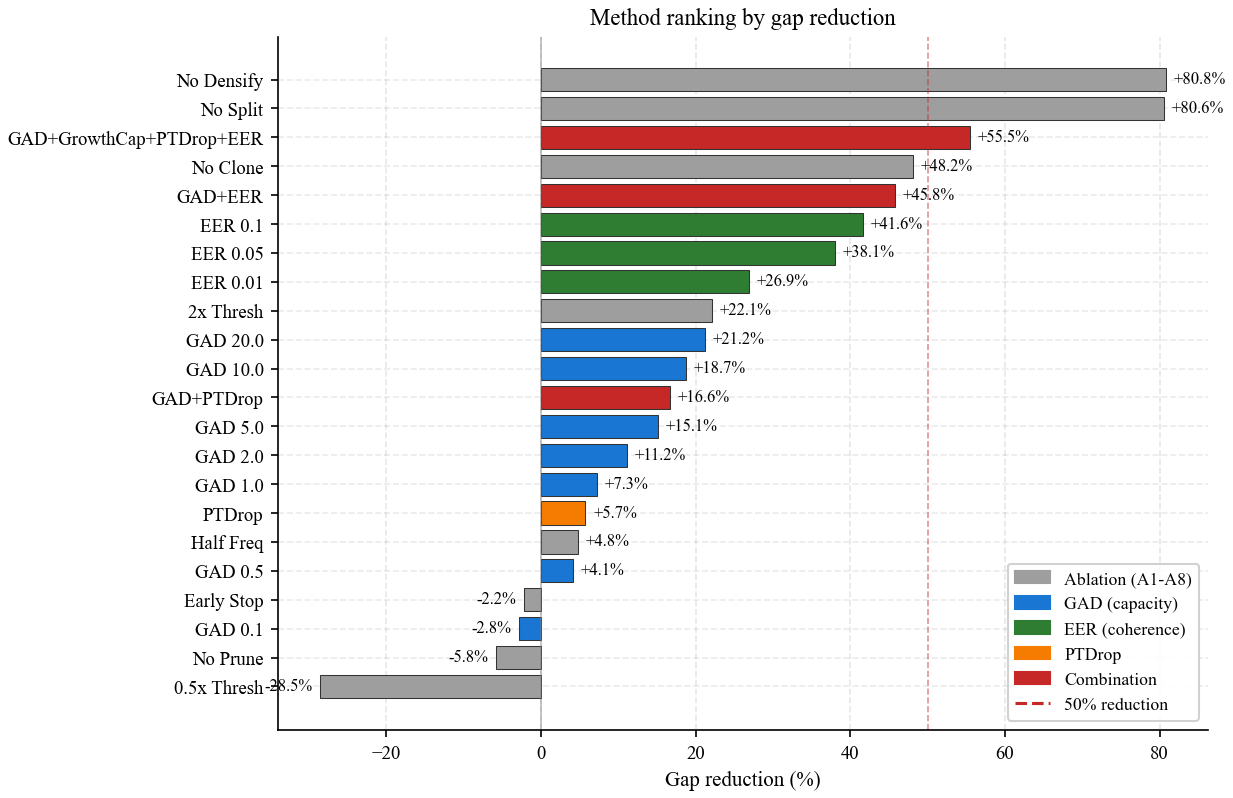
GAD+LogiGrow+PTDrop+EER is the only configuration
that crosses 50%.
Two small drop-in methods, each one hyperparameter and about 20 lines of code:
We also tried spectral-gated densification, temporal Sobolev
smoothness, SH-coefficient penalties, and opacity-entropy
maximization (SGD / STSR / ChromReg / OEM). At our scale none moves
the gap by more than 10%, so the v2 paper documents them as negative
results rather than first-class methods; the v1 paper
(PDF, companion
main_v1.tex) has the full taxonomy for reference.
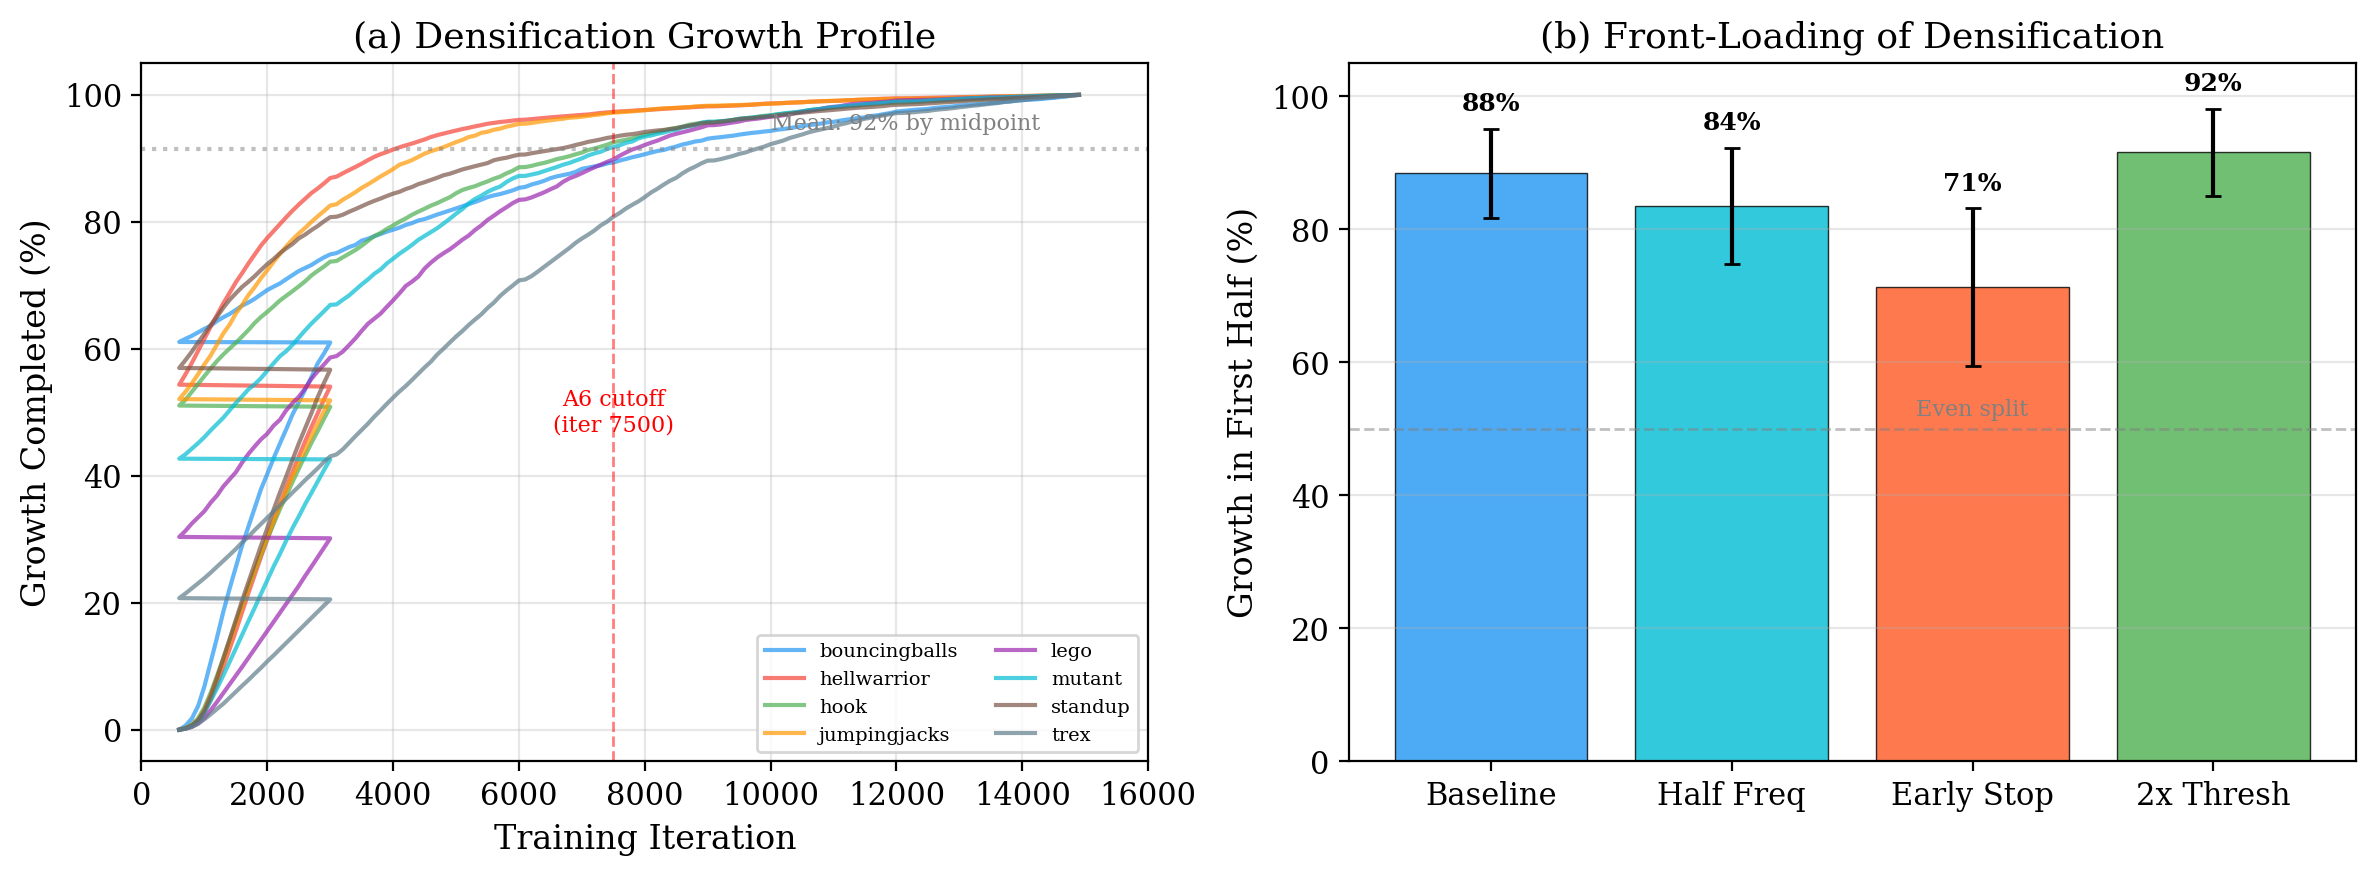
We adapt the per-iteration gradient threshold as
where K(t) is the current count, N is the number of training pixels, and Δℓema is an EMA of the per-iteration loss improvement. λ is the single tunable knob. The mapping from BIC to this formula is a heuristic (see paper, §6.2); the empirical diminishing-returns exponent we measure (α ≈ 0.04) is too mild to justify the often-quoted O((N/λ)1/4) growth bound, so we present the bound qualitatively as "sublinear in N".
For a subset of Gaussians i and their k=8 canonical neighbors j, we penalize
where u(x, t) is the deformation offset at time t. This is the discrete elastic strain — physically the correct choice for linear elasticity (Hooke's law penalizes ∂u/∂x, not ∂u). In canonical space the k-NN graph is stable; we rebuild it every 500 iterations and apply a cosine ramp from iteration 3K to 10K.
Explore the deformation field in 3D. Left panel: baseline (incoherent per-Gaussian deformation). Right panel: EER (coherent elastic deformation). Use the time slider to animate — watch how baseline Gaussians scatter chaotically at novel timesteps while EER maintains spatial coherence. Drag to orbit; scroll to zoom. Cameras are linked between panels.
12,000 highest-opacity Gaussians per scene, 11 timesteps (t=0.0 to 1.0).
Color by displacement magnitude (viridis) or strain (inferno).
Requires serving via HTTP (python -m http.server 8000).
For every D-NeRF scene, we load the trained 4DGS model, query the per-Gaussian deformation at 4 timesteps, and plot the distribution of per-Gaussian strain εi = meanj ‖ui−uj‖² / ‖xi−xj‖² over its 8 canonical neighbors.
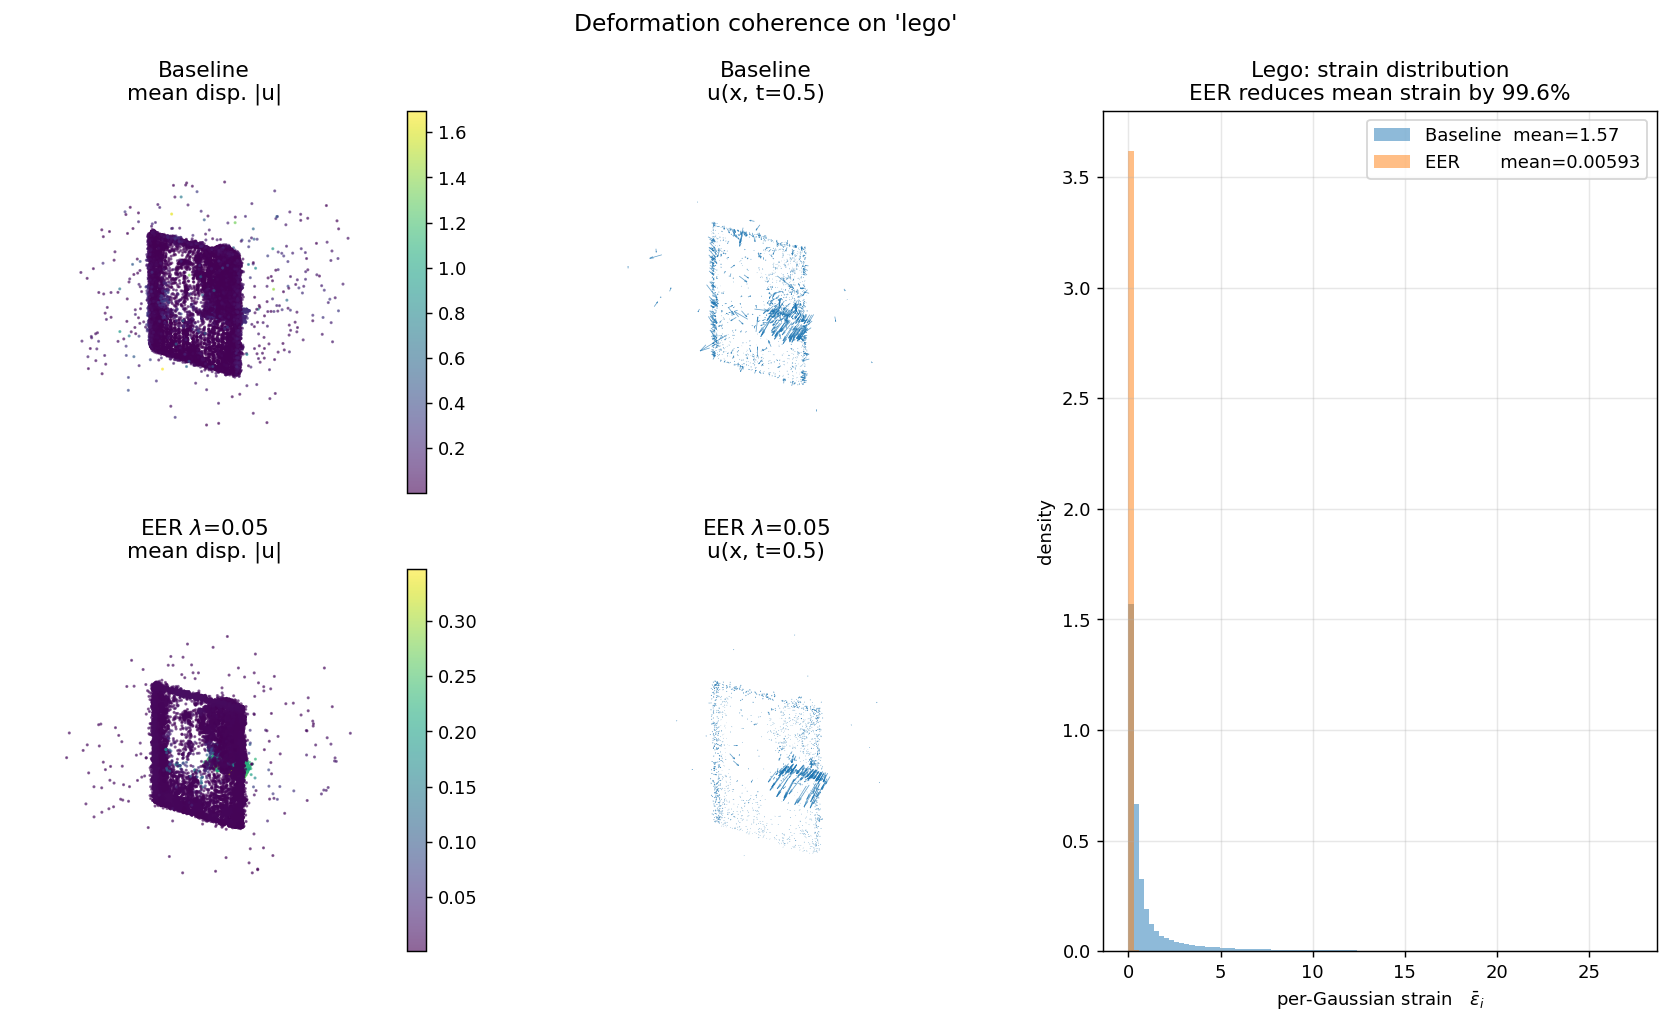
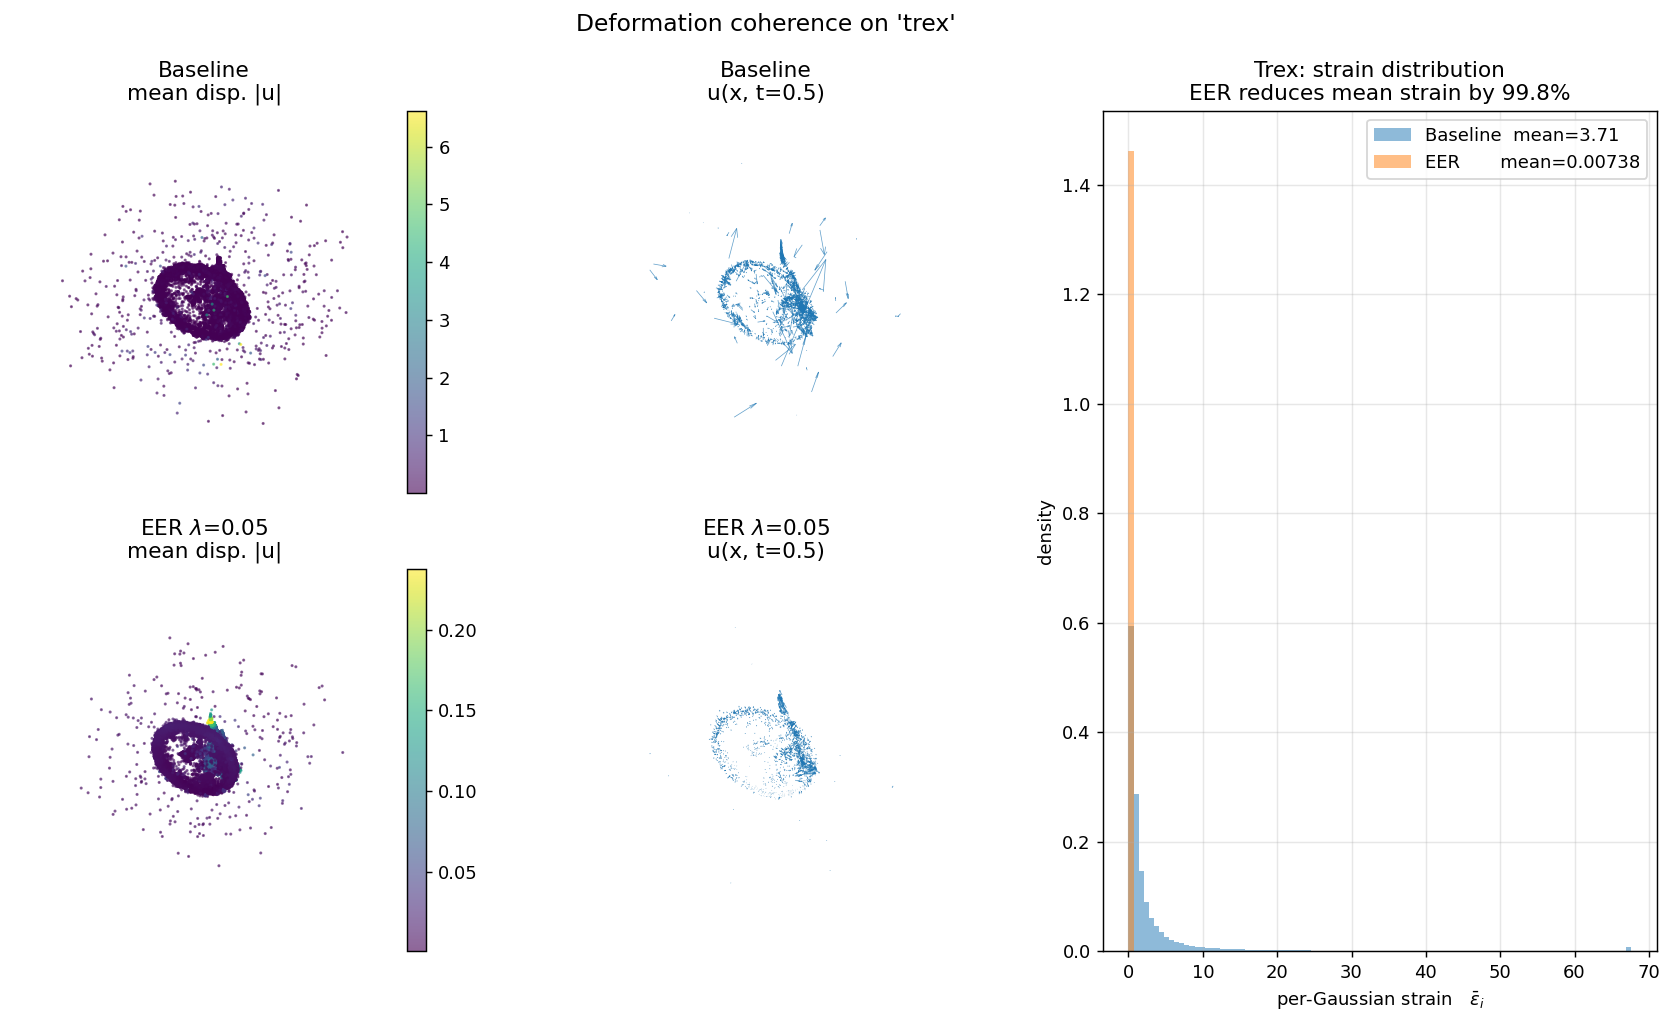
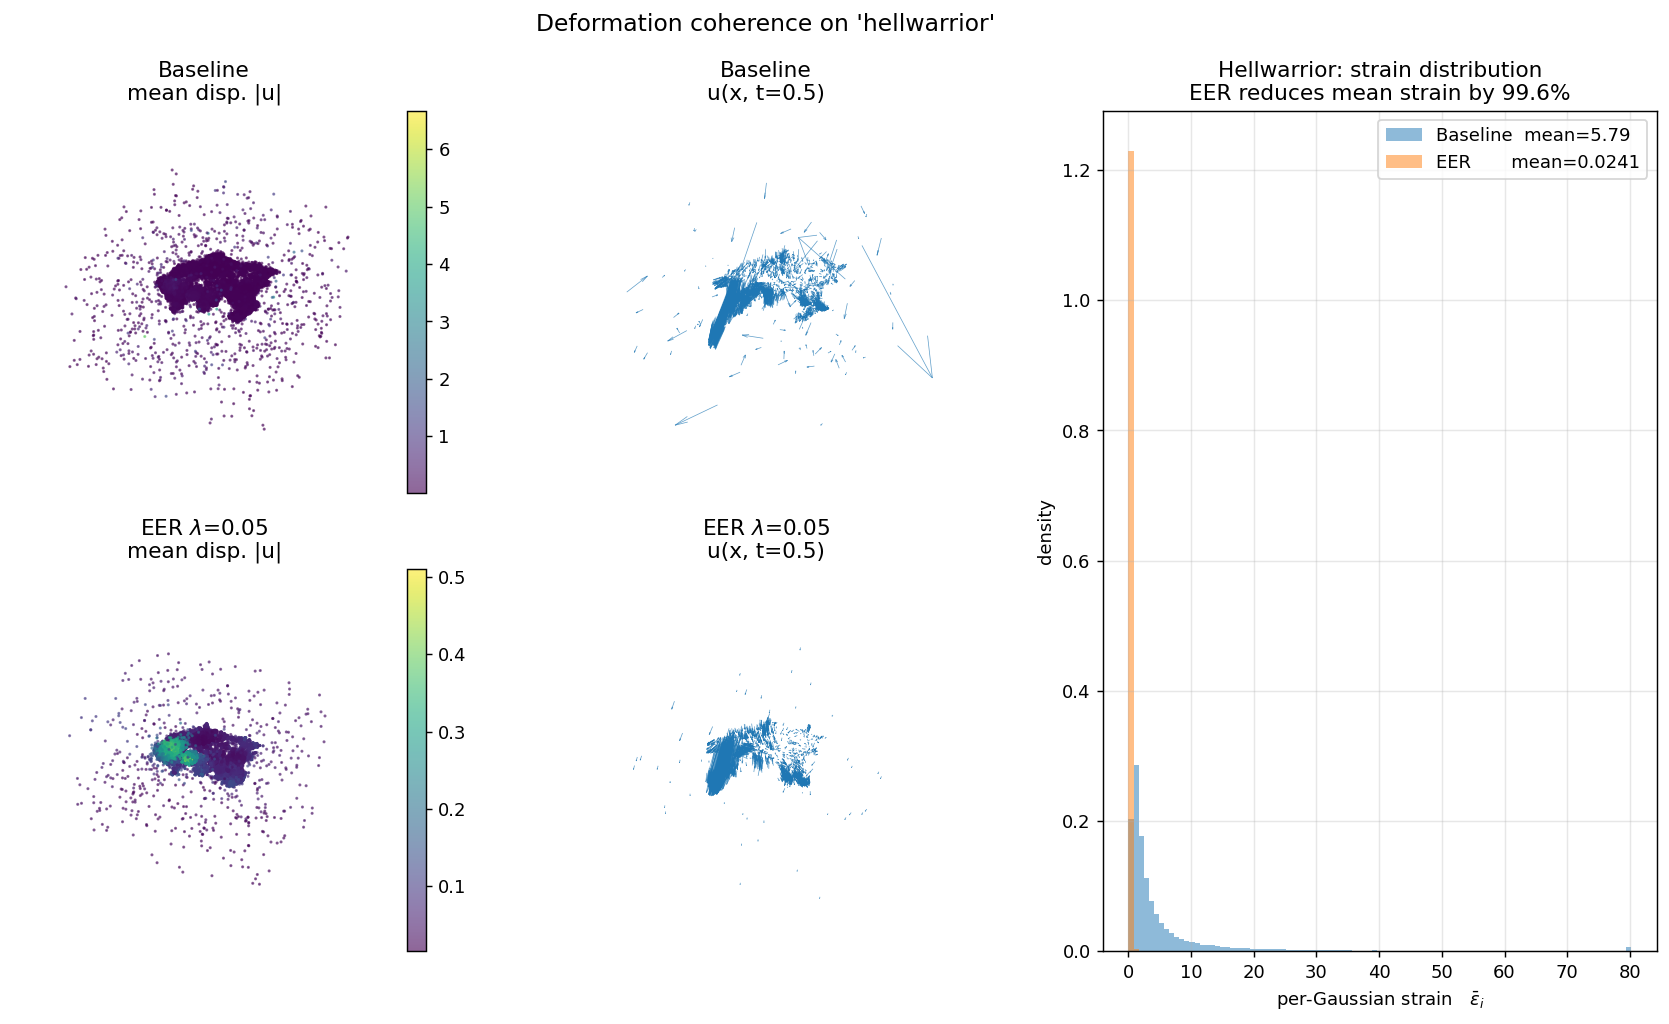
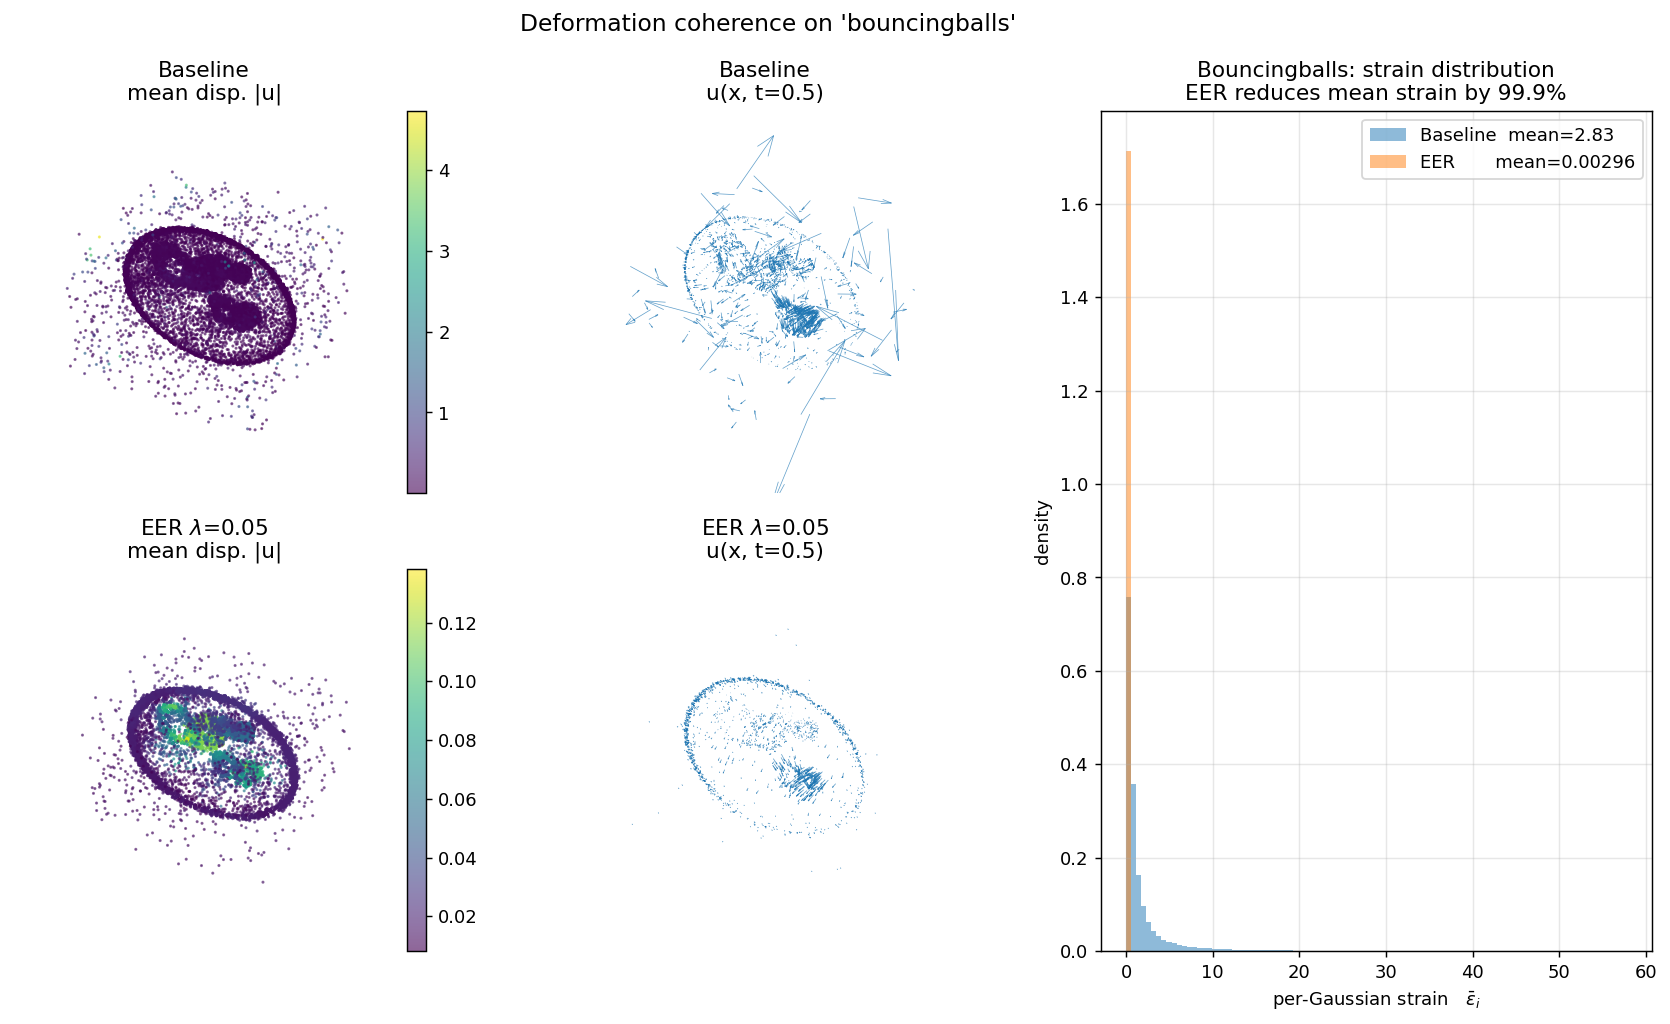
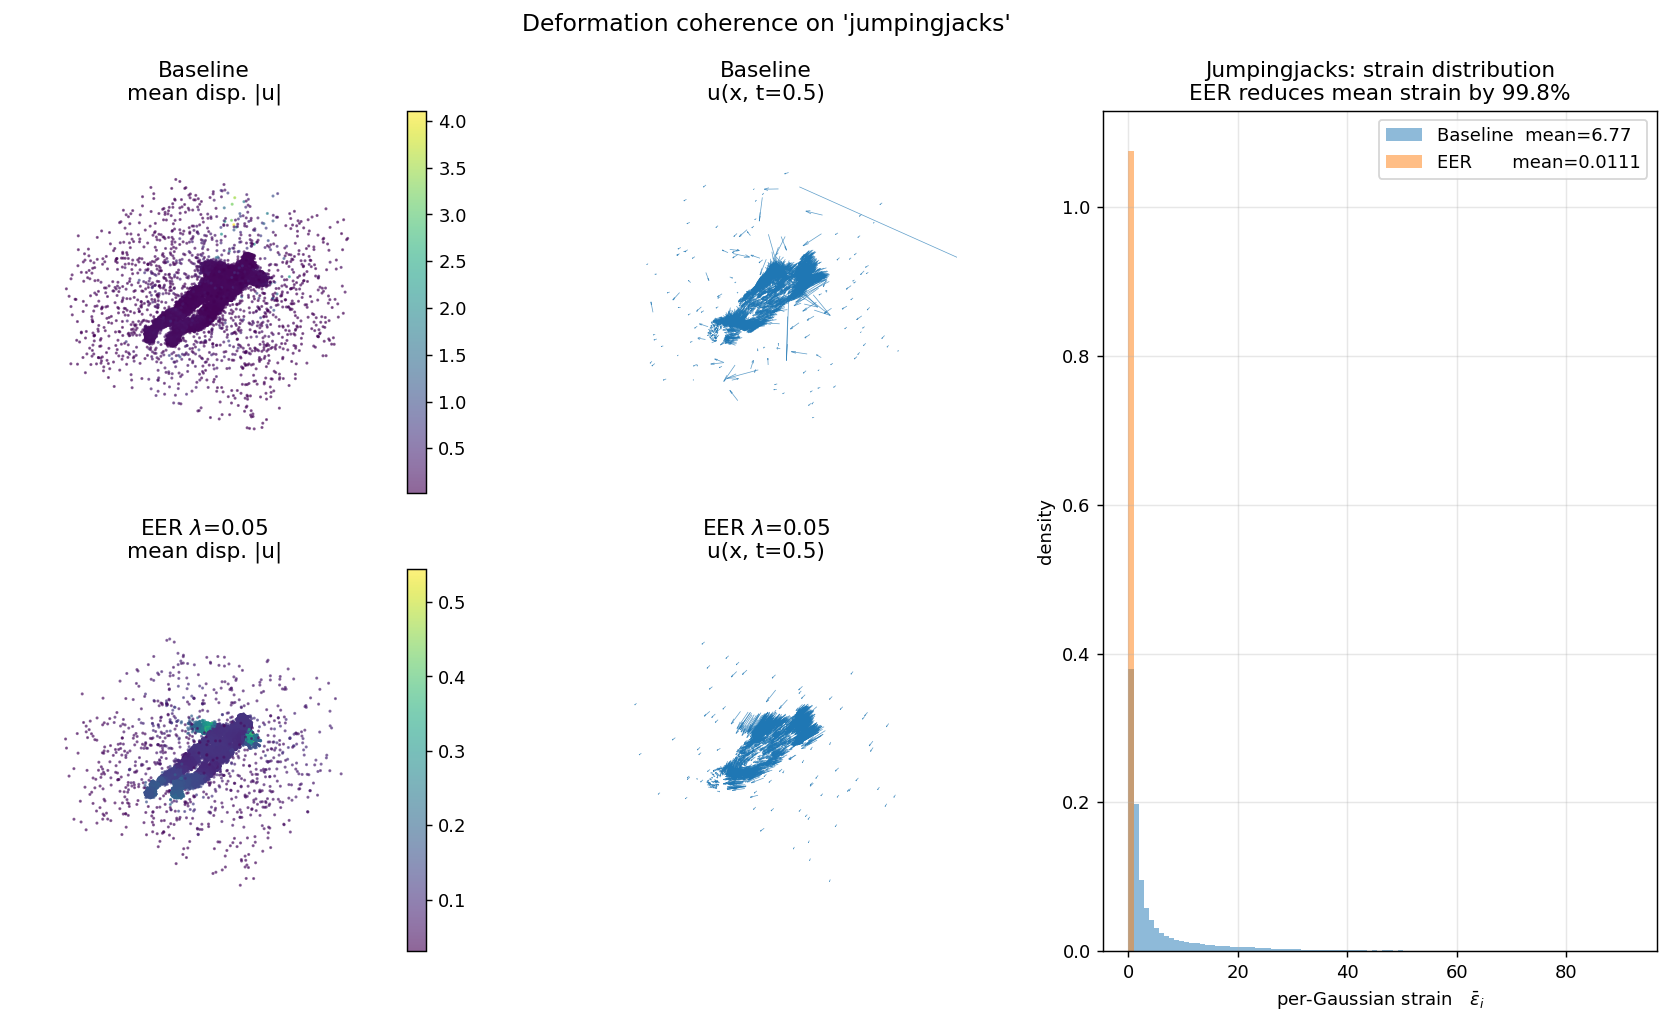
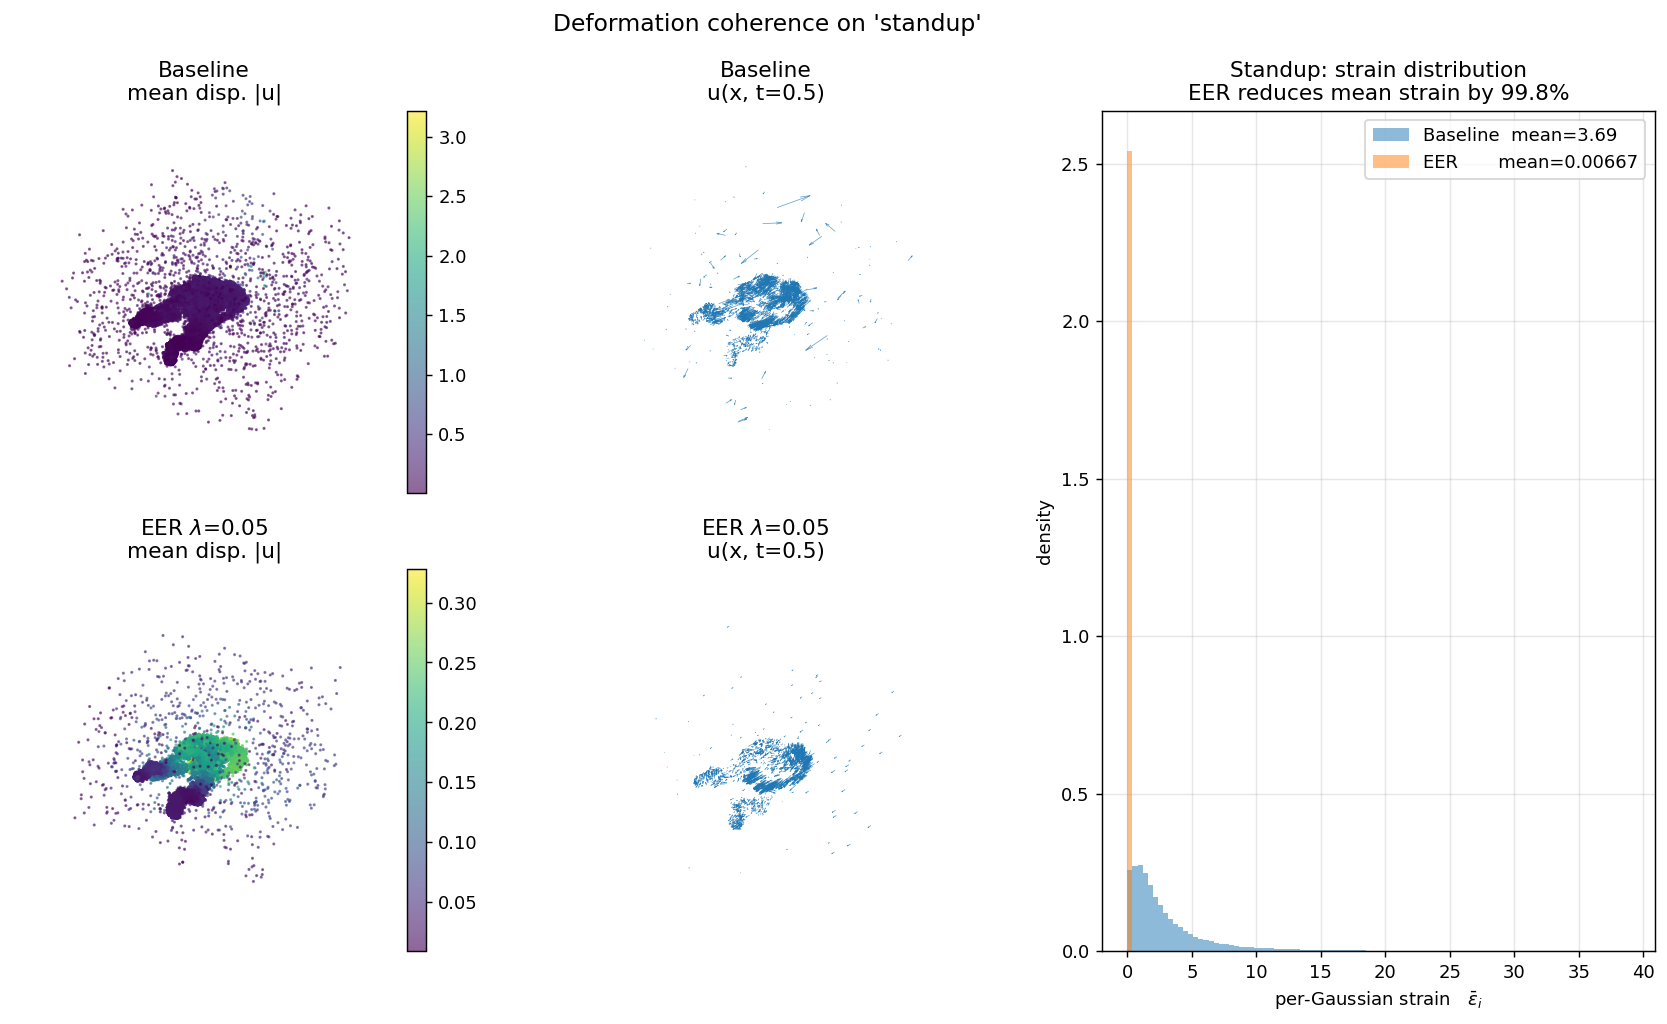
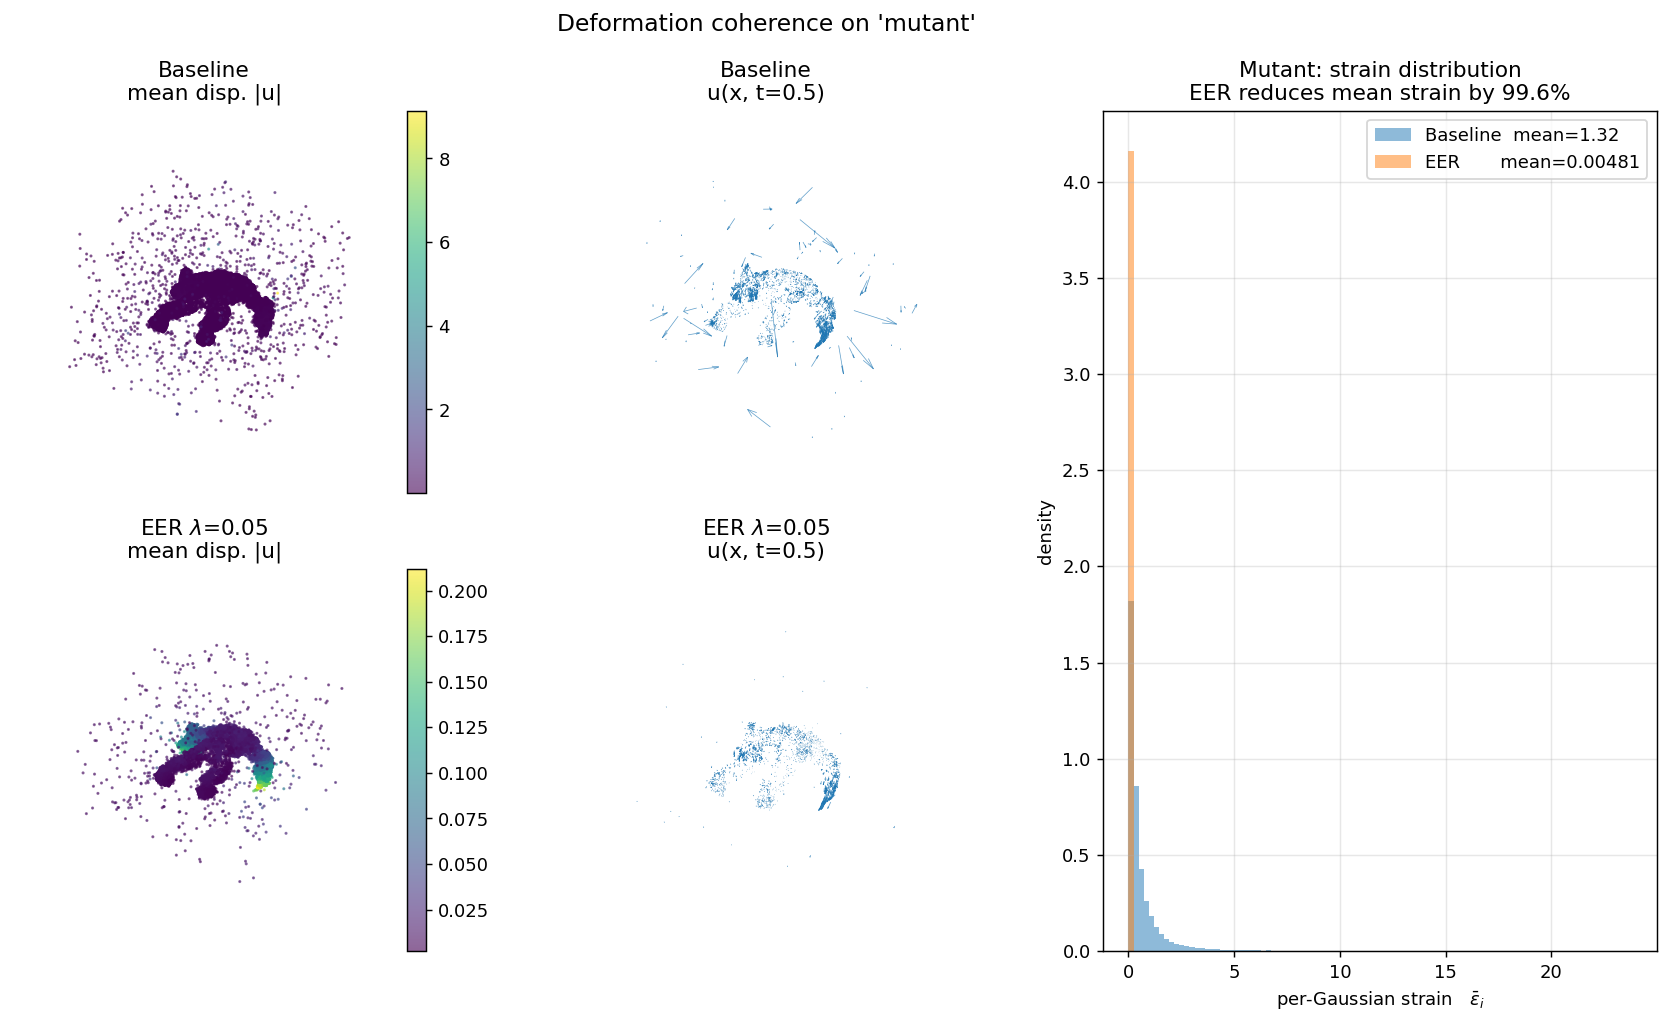
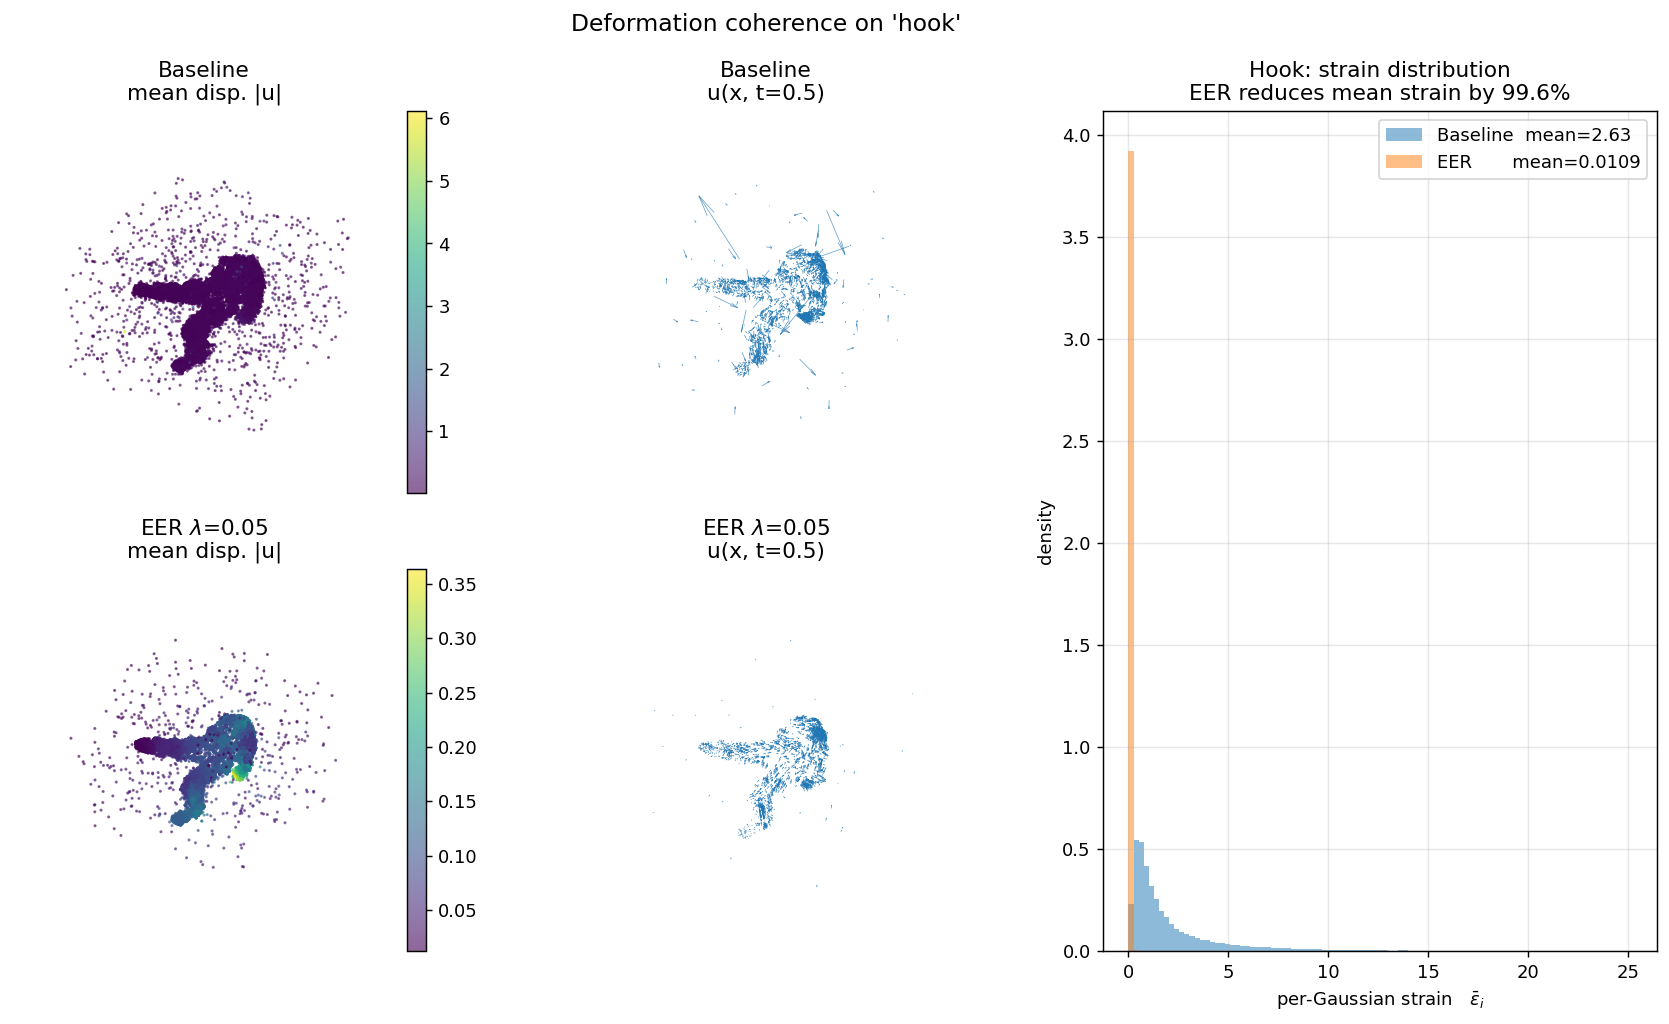
Each panel shows (left) canonical cloud colored by displacement magnitude, (middle) a subsampled quiver of u(x, t=0.5), (right) the per-Gaussian strain histogram. Baseline is bimodal with heavy tails; EER collapses the distribution by two orders of magnitude. This is the direct mechanism behind EER's overfitting reduction.
| Scene | Baseline ε | EER ε | Reduction |
|---|---|---|---|
| bouncingballs | 2.835 | 0.00296 | 99.90% |
| hellwarrior | 5.785 | 0.02408 | 99.58% |
| hook | 2.627 | 0.01090 | 99.59% |
| jumpingjacks | 6.772 | 0.01106 | 99.84% |
| lego | 1.573 | 0.00594 | 99.62% |
| mutant | 1.323 | 0.00481 | 99.64% |
| standup | 3.686 | 0.00667 | 99.82% |
| trex | 3.715 | 0.00738 | 99.80% |
| mean (n=8) | 3.539 | 0.00922 | 99.72% |
Measured at iter 20,000 on trained 4DGS checkpoints. Strain ε is mean over k=8 canonical neighbors of ‖ui−uj‖² / ‖xi−xj‖², averaged over 4 timesteps (t=0, 0.25, 0.5, 0.75).
EER transfers to real monocular video, in the regime where there is overfitting to remove. On 5 HyperNeRF scenes, with 4DGS and the same λ=0.05 tuned on synthetic D-NeRF — no per-dataset re-tuning — EER reduces the gap on the 3 high-baseline-gap scenes ($>$ 4 dB) at near-zero quality cost; on the 2 low-baseline-gap scenes ($<$ 2 dB) it is approximately neutral, as expected when the deformation field is already coherent:
| Scene | Baseline gap | EER gap | Reduction | ΔTest PSNR |
|---|---|---|---|---|
| chickchicken | 5.48 dB | 4.61 dB | +15.9% | −0.20 |
| slice-banana | 5.89 dB | 5.40 dB | +8.3% | +0.03 |
| vrig-3dprinter | 4.49 dB | 3.41 dB | +24.0% | +0.11 |
| high-gap subset mean (n=3) | 5.29 dB | 4.47 dB | +16.1% | −0.02 |
| vrig-peel-banana† | 0.89 dB | 0.83 dB | +6.6% | −0.23 |
| vrig-broom2† | 1.81 dB | 1.83 dB | −1.2% | −0.21 |
| full mean (n=5) | 3.71 dB | 3.22 dB | +11.0% | −0.10 |
4DGS on HyperNeRF, 14K iterations (stock config), RTX 3070. †Both vrig-peel-banana and vrig-broom2 have baseline gaps below 2 dB (at the floor of measurable improvement); reductions on these scenes are within reproduction noise. The high-gap subset (chickchicken, slice-banana, vrig-3dprinter) is the regime where EER clearly helps: +16.1% mean reduction at $-$0.02 dB cost — effectively free. The coherence finding survives noisy poses and non-Lambertian materials in the regime where the optimizer has overfitting to remove. EER's k-NN cost scales with cloud size; we could not extend to scenes where the cloud grows beyond $\sim$100K Gaussians on consumer hardware (see Limitations).
Main experiments are on 4DGS (HexPlane deformation). We ported EER and GAD to Deformable-3DGS (MLP deformation) and ran baseline + EER on three D-NeRF scenes for 20K iterations.
| Scene | Baseline gap | EER λ=0.05 gap | Reduction | ΔPSNR |
|---|---|---|---|---|
| lego | 13.15 dB | 13.56 dB | -3.1% | -0.02 dB |
| trex | 1.50 dB | 1.81 dB | -20.8% | -0.38 dB |
| hellwarrior | 4.08 dB | 3.87 dB | +5.2% | -0.22 dB |
Direct transfer at λ=0.05 is poor (mean −6% reduction). Why? Deformable-3DGS trains with L1+0.2·(1−SSIM) vs.\ 4DGS's pure L1 — the loss magnitude is roughly 3× larger and λ=0.05 is therefore under-regularized. Our dimensional-analysis note (paper §6.2) predicts the correct λ for Deformable-3DGS is ≈ 0.15–0.30. Testing this directly:
| λ | Gap (dB) | Train PSNR | Test PSNR | ΔTest | Reduction |
|---|---|---|---|---|---|
| 0 (baseline) | 13.15 | 38.38 | 25.23 | — | — |
| 0.05 | 13.56 | 38.77 | 25.21 | −0.02 | −3.1% |
| 0.15 | 10.23 | 35.55 | 25.33 | +0.10 | +22.3% |
| 0.30 | 8.26 | 33.60 | 25.34 | +0.11 | +37.2% |
| 0.60 | 7.82 | 33.21 | 25.39 | +0.16 | +40.6% |
To confirm the sweep is not Lego-specific, we replicated λ=0.30 on Hellwarrior:
| Scene | Baseline gap | EER λ=0.30 | Reduction | ΔTest |
|---|---|---|---|---|
| Lego | 13.15 | 8.26 | +37.2% | +0.11 |
| Hellwarrior | 4.08 | 3.54 | +13.2% | −2.44 |
The coherence mechanism transfers across deformation architectures and across scenes; the hyperparameter requires per-architecture (and to a lesser extent per-scene) calibration, exactly as the dimensional-analysis note predicted. On Hellwarrior the quality cost is larger at λ=0.30 (−2.44 dB); a smaller λ like 0.05 already gives +5.2% gap reduction at only −0.22 dB.
@article{droby2026monodygs,
  author  = {Ahmad Droby},
  title   = {Incoherent Deformation, Not Capacity: Diagnosing and
             Mitigating Overfitting in Dynamic Gaussian Splatting},
  journal = {arXiv preprint},
  year    = {2026}
}